Thursday, July 19, 2012

Middle Management


A Game of Skill:
Professional football coaches, analysts, scouts, and players often use the term "skill players."  Skill positions include the quarterback, running back, wide receiver, corner back, and safety.   Players at these positions are generally leaner and faster than linemen, and must provide skills such as throwing and catching that their more bulky teammates need not showcase.  What does the term "skill position" or "skill player" have to do with America's summer pastime?  Baseball, like its cousin football, can classify certain positions as needing more adroitness than others.  For argument's sake, no doubt every position in baseball needs skills, talent, and athleticism.Yet, the architects of an MLB roster must place greater emphasis and analytic energy into filling the positions of catcher, shortstop, second base, and centerfield.  One might place pitcher into a similar category, but for the sake of brevity let's reserve that for a separate discussion.  

Looking up the Middle:
Dr. Egon Spengler


To quote Dr. Egon Spengler from the movie Ghostbusters, "What are we talking about here?" Well, doctor, that's a great question.  I, not we, mention skill positions because I argue that they truly matter when forming a winning team.  I mentioned that baseball's skill positions are those that reside up-the-middle.  If one were to stand at home plate and look directly toward centerfield the positions in direct view are classified as the up-the-middle positions.  

No one who has ever played or followed baseball would disagree with the statement "Catchers are uniquely different from any other player on a baseball field."  Catchers have the onerous duty of protecting the most coveted spot on the baseball field, home plate.  They must know everything the pitcher knows, be able to throw out runners attempting to steal a base, perform their role as receiver, and hit at least well enough to remain in the line up on a nightly basis.  

While no position is as multifaceted or has as much responsibility as the catcher, shortstops play an important role as well.  Shortstops must simultaneously cover the most ground and deal with the most plays in the infield.  More righties play baseball than lefties; thus more ground balls are hit to the left side of the field than the right.  In addition, the shortstop must have a stronger and more accurate arm than the second baseman, while also playing an important role in all attempts to steal second base.  Often overlooked but no less important, the shortstop also plays a crucial role in directing and executing cut-offs from the outfield.  This list of responsibilities only covers the defensive tasks required of an MLB shortstop; the offensive duties are vast, but vary from player to player.  Overall, the shortstop is the captain of the infield, and usually constitutes either the top defensive talent or vocal leader on the team.  

Can You Spot the Up-The-Middle Positions?
Second base, while not requiring as many tools as shortstop, has many obligations.  The second baseman combines with the shortstop on double plays, cut-off throws, covering second on stolen base attempts, and most importantly, patroling the right side of the infield.  This last responsibility can become more difficult when the first baseman must cover first base in case of a pick-off attempt.  Speed, quickness, and range, constitute only a few of the necessary tools needed to play second base.

Finally, let's talk center field.  Defensively, the center fielder covers the most ground in the outfield, and must have a good arm in order to throw out runners attempting to reach second or third base.  Communication becomes paramount when playing centerfield as the centerfielder must range towards his counterparts in right and left field often, doing so while hoping to avoid a collision.  Some of the most athletic and talented players ever have roamed centerfield including Willie Mays, Ken Griffey Jr., Joe DiMaggio, Mickey Mantle, and Ty Cobb.  

As in the construction of a skyscraper, a solid foundation is vital.  While every position makes up 1/9 of the starting line up for an MLB team, these 4 position players are less replaceable than the other 4 (recall we have exempted the pitcher).  We speak often of wins above replacement or the value of a replacement player, but rarely, amidst all of this talk of replacement, do we remark that certain positions are not as replaceable as others.  Skill positions require specifically skilled or multi-skilled athletes that are not often found in left field, right field, third base, and first base.  

Often times, when I analyze a team the first thing I look at is the play and statistics of the skill position players.  Think about the best teams in baseball right now.  The Rangers, Angels, Yankees, and Braves all have very good up-the-middle combinations. (For a list of every team's fWAR up-the-middle positions click HERE)  The Rangers have the highest combined fWAR of any catcher, shortstop, second base, center field composite in baseball at 11.1 fWAR.  Josh Hamilton, Elvis Andrus, and Ian Kinsler are all indevidually having solid seasons.  The amalgam of Kinsler and Andrus provide above average to stellar defense up the middle for the Rangers.  Last season Kinsler and Andrus each had a UZR (a defensive metric incorporating a player’s range ) above 7.0, and this season both have been adequate up-the-middle.  While catcher Mike Napoli is experiencing a dip in every offensive category this season, Josh Hamilton's scorching start to the year has statistically made up for the regression of the Texas catcher.  

This chart shows the mean, median, range, and standard deviation of every 2012 up-the-middle position in Major League Baseball using fWAR as the evaluating statistic.


Mean
1.62
1.37
1.37
2.10
6.51
Median
1.4
1.4
1.4
1.9
6.55
Max
5.2
3.6
4.6
6.2
11.1
Min
-0.6
-0.7
-2.1
0.1
1.9
Standard Deviation
1.39
1.01
1.51
1.66
2.36
Turning the Double Play

Using UZR as our defensive metric of choice, the best defensive shortstop in MLB is Brendan Ryan of the Seattle Mariners, and the best second baseman is Robinson Cano of the Yankees.  You may have never heard of Ryan but Cano is a household name. He will compete for American League MVP this year.  Ryan adds little offensively, but due to his defense, he has saved about 14 runs from scoring this year.  That's about twice as many as the second best defensive shortstop in the majors, Starlin Castro of the Chicago Cubs.  Ryan's value comes almost completely from his defense.  Despite being far and away the best defensive shortstop, Ryan has only a 1.7 fWAR which is just above average for all MLB shortstops.  

Center fielders have it all.  They can run, jump, hit for average, hit for power, and play a highly valued skill position.  The best players in MLB in 2012 thus far have been center fielders.  Four out of the top 10 players according to fWAR this year play centerfield.  They are Andrew McCutchen of the Pirates, the Braves Michael Bourn, the Tigers’ Austin Jackson, and Angels rookie sensation Mike Trout.  Ever heard of these guys? If you haven't, I would advise learning about them, because all 4 are now and will be the best overall players in Major League Baseball for years to come.  

Eight years, $160 million dollars.  That is the contract recently signed by Dodgers center fielder Matt Kemp. Orioles center fielder Adam Jones recently signed a 6-year $85.5 million contract and others like B.J. Upton (Rays) and Michael Bourn (Braves) will soon be far wealthier men. Why will these players be paid so much money? Production.  Center fielders not only hit for average and power, but they also play great defense, and steal bases.  These deliverables, performed at a high level, usually lead to large contracts and, occasionally, world domination.  

Two of the best defensive catchers in the majors are Yadier Molina and Carlos Ruiz.  Include Joe Mauer and Buster Posey, and you have just identified a pair of players who have already signed huge contracts, Mauer and Molina, and a pair who will soon demand large sums of money, Ruiz and Posey.  Oftentimes, teams care less about offensive production from their catchers because of the value placed on a catcher's defense.  The four aforementioned catchers all hit well in addition to playing above average defense, and thus, like the center fielders mentioned above, represent some of the most complete players in all of Major League Baseball. 

Making the Big Money

What can we conclude from all of these data? Up-the-middle positions represent the keystone of a baseball team.  The 2012 Arizona Diamondbacks, Philadelphia Phillies, Minnesota Twins, and St. Louis Cardinals all have up-the-middle combined fWARs of 8.2 or above -- at least one standard deviation above the mean -- which proves that these squads will most likely remain competitive this season and have strong foundations on which to build for years to come.  

While up-the-middle position players represent the most complete athletes in baseball, corner outfielders, third baseman, and 1st basemen get much of the publicity and money.  The top 15 largest contracts ever signed in baseball history have been as follows: 

1
Alex Rodriguez
3B
2
Alex Rodriguez 
3B (Contract #2)
3
Albert Pujols
1B
4
Joey Votto
1B
5
Prince Fielder
1B
6
Derek Jeter
SS
7
Joe Mauer
C
8
Mark Texiara
1B
9
C.C. Sabathia
LHP
10
Manny Ramirez
LF
11
Matt Kemp
CF
12
Troy Tulowitzki
SS
13
Adrian Gonzalez
1B
14
Miguel Cabrera
1B/3B
15
Carl Crawford
LF

Nine of the 14 non-pitchers on the list play a corner outfield, 1st or 3rd base.  Interestingly enough, the positions getting the largest contracts are not the same as those with the highest valued players.

In the End:
Whether you are at the ballpark, watching on television, listening on the radio, or checking the scores on the internet, next time you want to evaluate a team about which you know very little, check the players at catcher, 2nd base, shortstop, and centerfield.  If those players are solid, the team may be more formidable on a game-to-game basis than perceived by the general public.  


Wednesday, July 11, 2012

Slowing It Down

Pitching, Yes Pitching
The pitcher's mound is 10 inches from the ground, 18 feet in diameter, and 60 feet 6 inches away from home plate.  No game can begin without the man standing 10 inches higher than the rest of the players winding up (that's a fitting phrase), and propelling himself forward towards the other half of the battery squatting behind home plate.  What happens next is too variable to predict, but provides every anticipatory spectator a fleeting moment of excitement.  Poetic rhetoric aside, the pitcher's mound, often dubbed the bump, matters little in comparison to the men who stand atop it.  I've written about pitching and pitchers before, but it fascinates me more than any other topic in sports, thus prepare yourselves for another round of "let's talk pitching".  

All Shapes and Sizes, The Young and the Old
Angels RHP Jered Weaver
One man stands 6 foot and weighs approximately 197 pounds, while the other measures 6 foot 7 inches tall with a slender frame of 205 pounds.  One has 4 Cy Young Awards and the other a Twitter account.  If one were to look at Greg Maddux and Jered Weaver side-by-side, it might be difficult to comprehend that these two men not only both play(ed) professional baseball, but represent two of the best pitchers to do so.  Weaver looks like a typical California kid.  With long dirty blonde hair, a wiry frame, and an odd delivery that looks like he is attempted to fold himself into two, the righty looks like the perfect fit for the Los Angeles Angels of Anaheim. 
In comparison, Greg Maddux, one of baseball's all-time greatest pitchers, does not compare physically to Jered Weaver.  Maddux, a Texan, looks simultaneously bullish and boyish, a combination perfect for a star pitcher in the Major Leagues.   

The Great Greg Maddux
If appearance constitutes only one of the numerous contrasts between Maddux and Weaver, the second is that Maddux retired from Major League Baseball in 2008 while Weaver began his career in 2006.  Third, Maddux and Weaver never played for the same organization, and neither pitcher has ever been linked to one another in any professional manner.  This is where the dissimilarities between the two pitchers stops.  In fact, to underline the similarities, both even have brother's, Jeff Weaver and Mike Maddux, who have previously been or are currently involved in Major League Baseball.  

Nonetheless, why have I chosen, what seems like two random pitchers, to compare and contrast.  While watching a recent performance by Jered Weaver, I noticed a significant difference in his velocity from his first few seasons in the Majors.  Weaver came up in 2006 throwing consistently in the low 90's, often touching 94 mph.  Check out Weaver's career velocity chart, courtesy of Fangraphs.com.
As you can see, Weaver's fastball could never be considered blazing, but the recent trend shows a true dip in his velocity.  In 2011 and thus far in 2012, Weaver rarely heaves his fastball at speeds above 90 mph, let alone the consistent 91-93mph clip he displayed in 2007 and 2008.  What caused Weaver's drop in velocity, and more importantly, how has he remained so dominant despite less zip on his most used pitch?  

The answer is simple, Weaver has adjusted his style and simultaneously matured as a pitcher.  Weaver's change in pitching style reminded me of the other subject of this piece, Greg Maddux.  Maddux, known by most as a control pitcher.  He never utilized high velocities to overpower hitters, but instead used deception, creativity, and pinpoint control to make hitters' lives miserable.  While other legends like Roger Clemens, Steve Carlton, and Randy Johnson went the more conventional rout of getting hitters out with mid to high 90's fastballs, Maddux learned early on that, in order to not become an average pitcher, he had to do something else to compensate for his lack of speed.  It seems as though Jered Weaver may be following in the footsteps of the great Greg Maddux.  

Before we delve further into the velocity discussion, let's compare the two pitchers a bit more.  First, since Weaver has only been pitching for 7 seasons, I only looked at Maddux's first 7 full seasons(1987-1993) as well.  Over his first 7 seasons, Jered Weaver has compiled a 29.4 fWAR, 30.1 rWAR, and 21 WARP (I mention all three types of calculating WAR because each one is a bit different).  From 1987-1993 Greg Maddux spotted a 37.1 fWAR, 30.1 rWAR, and 21.7 WARP.  If we look at WAR/season we see that Maddux, probably due to his outstanding defense, as well as his greater propensity for obtaining ground balls, has an edge.  As a fly-ball pitcher, Weaver benefits from a steller trio of defensive outfielders, Mike Trout, Torii Hunter, and Peter Bourjos.  
fWAR/season
rWAR/season
WARP/season
Maddux
5.30
4.30
3.10
Weaver
4.20
4.30
3.00
For the record, in order to perform these calculations, I doubled Weaver's current WAR numbers from 2012 (the league is at the midpoint of the season and I'm assuming Weaver will remain consistent).  Here are some other numbers to consider: 
HR/9
BB/9
K/9
K's
Maddux
0.50
2.70
6.00
1123
Weaver
0.90
2.00
6.80
1114
Maddux's ability to keep the ball on the ground keeps his HR/9 numbers low.  Weaver does not use the ground ball as well, but keeps batters from reaching base by compiling more strikeouts and fewer walks per 9 innings.  In addition, Maddux' average batting average against vs. left-handed batters from 87' to 93' was .264, while Weaver has put up a .238 average vs. left-handed hitters.  Weaver and Maddux produce outs in different ways because their style of pitching is different, but both yield ace-like results.

When first examining the data, I began to hypothesize that Jered Weaver, pending health status, could end up with a similar career to Maddux.  Now, after some serious thought my prediction has changed.  I now see Weaver as a pitcher who will most-likely come close but not match the iconic level attained by Maddux. Nonethless, both pitchers figured something out about velocity that few other pitcher have done.  Often times, it is control, pitch selection, and dedication to one's craft that exceed the value of a 95 MPH fastball.  

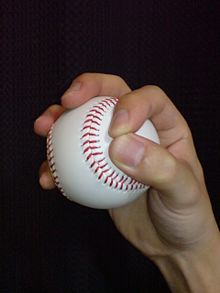
Circle Change Up Grip
When Greg Maddux began his career in the Major Leagues, his fastball was consistently clocked between 90-92 MPH, but over the next 7 seasons his fastball would more readily be clocked between 88-90 mph.  While the speed of his fastball changed, so did his use of two other pitches.  First, Maddux mastered the circle changeup.  The ball is held against the palm of the hand, thus creating a drop in speed.  Due to the circular grip applied with the thumb and pointer finger, the pitch tends to move inside to righty's and away from lefty's (if the changeup is thrown by a lefty pitcher the movements are the exact opposite).  The most important part of a change up is to have similar arm speed to a fastball, in order to use the difference in velocity to trick the hitter.  Check out this pitch f/x data from an April 7th, 2008 start by Maddux.


The fastballs and change ups all show similar vertical and horizontal movement.  By keeping the movement similar, Maddux continued to fool hitters with a change up despite the fact that neither pitch topped 85 MPH.  It is worth noting that as Maddux's career progressed he threw the straighter four-seam fastball far less, in favor of fastballs that had increase vertical and horizontal movement.

Weaver, like Maddux, may not throw more than 90 MPH, but he has found other ways to keep runners off base.  Weaver's average curveball velocity in 2012 has been 71.5 MPH, slower than many Major League curves.  He throws the hook with incredible 12-6 action creating a huge looping motion that a hitter has extreme difficulty timing.  In addition, Weaver has increased, yes I said increased, the velocity of his slider.  The slider, unlike the curveball, has greater velocity and a harsher break.  With the increase in speed, Weaver keeps hitters even more off balanced than before.  Finally, to complete the pitching comparison between Maddux and Weaver, both pitchers developed a sneaky pitch called a tailing fastball.

Tailing Fastball Grip
Often called a come-back fastball, the tailing fastball, when thrown by a right-handed pitcher, moves from left to right.  Greg Maddux made this pitch famous.  In fact his most famous influence on pitching may be concentrated in this area.  Maddux used the tailing fastball to freeze left-handed hitters who usually feast on fastballs thrown in the mid to high 80's.  He did so by starting the pitch as a ball on the inside and having it move laterally to catch the inside corner as the ball crossed the plate.  Currently, numerous right-handed pitchers, who do not throw overpowering fastballs, utilize the tailing fastball to jam or often strike out left-handed hitters.  According to pitch f/x, Weaver did not throw a tailing fastball for the first 4 seasons of his career.  In 2010 he began throwing the pitch 17.4 percent of the time, which became 19.1% in 2011, and finally in 2012 Weaver's tailing fastball made up 29.0% of his pitches.  

In conclusion, Jered Weaver is not a clone of Greg Maddux, in appearance or as a pitcher.  On the other hand, the two have some parallels, especially similar pitching styles that have made them great pitchers.  According to Baseball-reference.com, Greg Maddux ranks as the 5th best pitcher in baseball history. These rankings are based on fan voting, but at the very least, they give you a decent perspective as to where Maddux might truly rank.  On the same list, Jered Weaver comes in at #284.  I will reiterate that while I do not think Jered Weaver will become the next Greg Maddux, but he has used similar philosophies of pitching, specific tweaks, to enhance his craft and keep him in the annual discussion of Cy Young candidates.  

Thursday, July 5, 2012

What a Relief

The Background

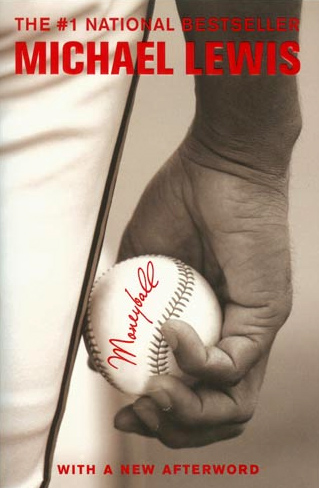
The Book...Enough Said
In Michael Lewis' famed book, Moneyball, he hammers home the point that the A's did not stumble upon the idea, that in order to build a winning team with very little money, a General Manager must find market inefficiencies to exploit.  The idea comes from economics.  Market inefficiencies arise when one agent within the market uses their power to block mutual gains from trade, leading to imperfect competition.  Essentially, if one entity within the market abuses their stature by obstructing the natural flow of a certain good, it can cause monopolies to arise.  To quote the book that opened so many people's minds to the statistical revolution that is still occurring in baseball, "The chief social consequence was to hammer into the minds of a generation of extremely ambitious people a new connection between "inefficiency" and "opportunity," and to reinforce an older one, between "brains" and "money."

Moneyball was written in 2003; a movie based on the book was released in 2011, and because of the book almost every major sports news channel on television includes statistics like on base percentage in its usual stat line.  This begs the question, why am I digging up an argument that most sports fans have heard of? The reason I mentioned market inefficiencies and more importantly Moneyball is that Billy Beane, the General Manager of the Oakland Athletics, continues to find market inefficiencies to exploit in order to keep his team relevant amidst a sea of fat cats, copycats, and monopolies (thought I had a third cat phrase didn't you?).

Back to our brief economics lesson, let's talk about externalities.  An externality is a transaction that does not occur through prices, and affects a party that had no say in the transaction that caused the issue.  Externalities can range from global climate change to taking too much time in the checkout line at your local grocery store.  How do externalities and market inefficiencies affect Billy Beane and the Oakland Athletics? Beane's small-market team has little money to throw around in order to, simply put, win.  In order to combat this lackluster position, Beane and his front office team, scourer the baseball landscape for the numerous market inefficiencies that have occurred, most often due to externalities, to exploit in order to bring success and prosperity to the "other" city by the bay.

Beane's most recent revelation concerns relief pitching.  Starting pitchers usually pitch anywhere between 5-9 innings per game.  Starting pitchers who average more an 7 innings pitched per game are usually aces, while pitchers who average fewer than than 6 innings pitched per game rank closer to average/below average in performance.  No statistic is without outliers, and Stephen Strasburg represents a great outlier.  The Nationals purposefully limit his innings pitched despite his stellar ability, in order to protect his arm in the long-term.  Nonetheless, starting pitchers rarely throw complete games, which causes managers to utilize their bullpens often.

Combine the effect of fewer innings pitched by starting pitchers, with the new model of the modern bullpen and you change the market for pitchers.  Tony La Rusa, the soon-to-be Hall of Fame manager of the Oakland A's and St. Louis Cardinals, started the current bullpen paradigm of lefty specialists, set up men, and the worst of the bunch, the rigidly limited closer.  This shift in bullpen dynamics, combined with the invention and overvaluing of the "save" statistic, has led to a market inefficiency.  When specialization occurs, oftentimes the salaries of those filling these specialty roles rise.

Let's examine the most lucrative specialty, the closer.  The average salary for a closer in 2012, excluding closers still signed to a minor league deal, and including injured closers and their replacements, is about $6 million.  These are pitchers who generally pitch for an inning in which their team is ahead by no more than 3 runs.  Sometimes closers are put in in tie games, and when they haven't pitched in a while, the manager may choose them to pitch in order to stay sharp.  Supposedly these "rules" are placed on a closer's usage because the 9th inning involves so much added pressure, that only certain players can successfully get the last three outs of a game.  My argument here is not that closers are useless, (sort of) or that the system in which they are employed is inherently flawed (it is).  The point I'm trying to make is that Billy Beane and his cadre in Oakland discovered that because of system in which closers pitch, the market has overvalued them, and will most likely continue to do so.

Bailey, Street, and Cook

Heading into the 2011-2012 off-season, the Oakland A's were coming off of a losing season, but one on which the team could build.  The Athletics finished the 2011 season with a 74-88 win-loss record, a .457 winning percentage that left them 3rd out of 4 teams in the American League West.  Despite this record, the A's held a number of solid young players that, with some experience and help from veteran talent, might produce winning seasons in 2012 and beyond.

All of this seems reasonable but the Oakland A's are not your average MLB team.  With so little money to utilize, the A's must constantly use a strategy employed by the Tampa Bay Rays as well as the financial sector.  The strategy is called arbitrage.  Arbitrage is the act of taking advantage of price differences between markets by making one or many deals in order to capitalize on the imbalance.  In his book The Extra 2%, Jonah Keri talks about how the Rays utilize the idea of arbitrage when making player based decisions.  Mr. Keri explains it simply as "acquiring an asset for less than it's worth, especially when coupled with selling an asset for more than it's worth."  The Athletics have recently used this approach to exploit the overvaluation of closers and other relief pitching slots in order to improve their team.

At first glance, Huston Street seems more like then name of a road rather than the name of a Major League Baseball player.  Street attended the University of Texas, and was drafted by the Oakland Athletics in the 1st round of the 2004 MLB draft.  Street came out of the bullpen in college and the A's had no desire to change that approach.  He pitched for the A's from 2005-2008 at an average of $1,083,906.25 per season.  He was paid $3.3 million in his final season with the A's, one in which they traded him elsewhere.  Street came out of the bullpen as the Athletics closer.  His stats from his bay area years are depicted below.

Team
ERA
SV
IP
K/9
H/9
Athletics
2.88
94
269
9.07
7.03
HR/9
WHIP
LOB%
WAR
xFIP
BB/9
0.6
1.07
74.30%
6.9
3.51
2.61
After producing these fine numbers for the A's, they traded him, Carlos Gonzalez, and Greg Smith to the Colorado Rockies for Matt Holiday.  Holiday played for the A's and was then traded to the St. Louis Cardinals for prospects Clayton Mortensen, Shane Peterson, and Brett Wallace.  Wallace was then traded to the Blue Jays for outfield prospect Michael Taylor.  Confused yet?  Well if you aren't, let's move on.

Street was first, but Bailey came next.  The Athletics drafted pitcher Andrew Bailey in the 6th round of the 2006 MLB draft.  After spending a few years in the minor leagues, Bailey was brought up to the team to fill the vacant closer's spot left by Huston Street.  He immediately won rookie of the year and was selected to the All-star team, 
thus boosting his profile in Major League Baseball.  In addition, he compiled these statistics:

Team
ERA
SV
IP
K/9
H/9
Athletics
2.07
75
174
9.0
6.05
HR/9
WHIP
LOB%
WAR
xFIP
BB/9
0.57
0.95
81.70%
4.4
3.4
2.53
In 2012 Bailey was once again selected as the Athletics representative to the American League All-Star team.  Seeing that Bailey was a competent closer who, like Street before him, would be overvalued on the free agent and trade markets, Billy Beane traded his young commodity.  In this case he traded him to the Boston Red Sox for outfielder Josh Reddick, prospect Miles Head, and prospect Raul Alcantara.

Now that we have discussed Street and Bailey, let's move on to Ryan Cook.  Who is Ryan Cook?  If you guessed that he is an Oakland Athletics relief pitcher, you would be right.  Cook has recently been placed in the closer's role in the A's bullpen.  His statistics thus far can be seen below.

Team
ERA
SV
IP
K/9
H/9
Athletics
1.50
8
?
9.25
3.0
HR/9
WHIP
LOB%
WAR
xFIP
BB/9
0
0.92
82.90%
0.8
4.39
5.25


Okay, you got me; I may be throwing a whole bunch of statistics your way, but I neglected to tell you the sample size.  Cook has only thrown 36 innings out of the pen thus far this season.  The numbers Cook is putting up could easily normalize and become only average, but I don't think that will happen.  Oh, I think he may give up a home run eventually, but I have faith that by the end of the year, Ryan Cook will look like a solid choice as a closer.  He may be utilized in that role for the A's for the rest of this season as well as next season.  Interestingly, Cook was one piece the A's received when they traded SP Trevor Cahill to the Diamondbacks and the A's currently pay him $480,000 a year.
Ryan Cook

The Athletics play in a great pitcher's park, thus inflating their pitcher's stats and deflating those compiled by their offense.  With recent closer's being signed to deals like 4 years for $50 million (Jonathan Papelbon to the Phillies) and 3 years for $27 million (Heath Bell to the Marlins), many teams may jump on the chance to trade for Ryan Cook and utilize his arbitration years (the first of which is in 2015) or even sign him to a more moderate contract.  The A's may not garner an incredible package of players for Cook, but with the advanced metrics they deploy, the scouts they trust, and the replaceability of Cook, anything the A's get in return may make such a deal true arbitrage.

Finally...

In the end, I am predicting a situation based on lots of facts, a pattern, and some assumptions.  Teams devise new ways to improve themselves everyday, but Billy Beane has definitely found a market inefficiency to exploit in the production and selling of bullpen pitchers.  He uses them for his own team only while he pays them less than $1 million, then sells them for other players to teams who can, and will pay them more money.  The Athletics need all of the help they can get when it comes to winning, and Billy Beane is the man to keep them ahead of the curve.  Whether he uses simple economic principles like market inefficiencies, arbitrage, and positive gains from externalities, Beane continues to succeed.  Maybe, that's why he has been the Athletics General Manager for 15 seasons, the longest current streak in Major League Baseball.  

Monday, July 2, 2012

What Year Is It?


(It is my pleasure to introduce Morris Levin.  In addition to being the first guest writer on www.summerpastime.com, Morris Levin is an alumnus of Mitchell & Ness Nostalgia Co. He lives in Philadelphia, where he roots for the Phillies, win or lose. He is a proud booster of the Athletic Base Ball Club of Philadelphia and supportive of efforts in West Philadelphia to honor the legacy of the Philadelphia Stars.)

“It's beginning to smell a lot like 1979 around here”
Are the 2012 Phillies Mirroring Their 1979 Counterparts?

Expectations were high for the Phillies entering the 1979 season. The Phils had won the division with 101 win in 1976, 101 in 1977, and 90 in 1978. But in each of these seasons, they had lost the National League Championship Series.

The Phils had very strong clubs. Catcher Bob Boone, infielders Larry Bowa, Dave Cash, and Mike Schmidt, outfielder Greg Luzinski, and pitcher Steve Carlton were all repeat All-Stars. But they could not make it to the World Series.

Player free agency in Major League Baseball was a still a relatively new phenomenon in the late 1970s. After losing to the Los Angeles Dodgers in the 1978 National League Championship Series, the Phillies seized on the opportunity presented by all-time great Pete Rose’s first entry into free agency.

Rose had reached his 3,000th career hit in 1978, and hit in 44-straight games. Rose and Reds management were at odds, and the Phillies signed Rose for a then record four-year $3.2 million contract. Rose would be the piece that pushed the Phillies over the hump to the Series.

Prior to the 1979 season, Phils manager Danny Ozark had publicly speculated that his club lacked player leadership. Rose would lead the team to the World Series. The Phillies were very good with him and became stocked with him. Like having four ace pitchers.

Know what happened? The team finished fourth.

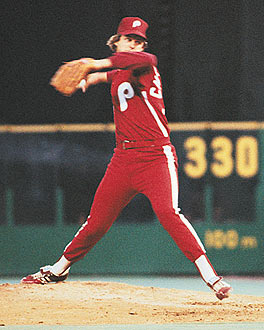
Larry Christenson of the 1979 Phillies
Reliable starting pitcher Larry Christenson cracked his shoulder in the preseason. Carlton started the season wounded. You think the 2012 Phillies are old? The planned 1979 rotation had Carlton at 34 years old, Jim Lonborg at 35 years old, and Jim Kaat at 40 years old. The team wilted in front of the media; Larry Bowa publicly lamented the added pressure and questioned whether the team could meet the expectations.
The 2012 Phillies bullpen is struggling so much that Chad Qualls was released by way of example. Tug McGraw led the 1979 team in saves with 16 and had an ERA of 5.16. The great McGraw was more Brad Lidge circa 2009. Ron Reed pitched 100 innings out of the pen and had an ERA of 4.15.

Rose continued his dominance, hitting .331 in 1979, and Schmidt cracked 45 homeruns with 114 RBIs. But midseason injuries to Luzinski, stellar double play combo Bowa and Trillo sank the team. By July 1st, the Phillies’ record was 39-38; fifth place in the six-team division, and still 7½ games back. By August 29, the team had fallen to fifth place and two games under .500, 12½ games behind the Pirates.

Trillo sustained a broken forearm on May 3 when he was hit by a pitch. Bowa broke his thumb May 22 diving for a ball in a win at home against the Cardinals. Garry Maddox went down injured, and later that summer Greg Luzinski was hurt. By mid-August, fifteen players had been to the disabled list and the Phillies were eight games out of first place. The team's decline led to the firing of manager Danny Ozark on August 31.

Yeah. 1979 was not a fun season for baseball at the sports complex in South Philadelphia under the weight of World Series expectations, and a fan base for whom winning the division, a dream five years ago, expected.

Here we are in July 2012 and the Phillies are mired under .500. Injuries to Ryan Howard and Chase Utley, Roy Halladay, and the middle-relievers have badly hurt the club. This does not exonerate Cliff Lee, Shane Victorino, and other playing at or below career averages. Nor does it exonerate management from not signing surer outfield hitting whether it may have been a Josh Willingham, Jason Kubel, Carlos Beltan, (or even resigning Raul Ibanez for one season).

Jimmy Rollins Hoists The World Series Trophy In 2008
The Phils should be able to right the ship in 2013. Whatever permutation in 2013 of Hamels or Halladay or Lee or Worley is around should be strong. Howard should be back following precedent that players who previously had Howard’s injury come back strong in their second year back and not their first. All the more reason the team should have signed one of the above rather than leaving it at the combination of Nix-Wiggington-Thome-Mayberry.

Money will be available from the contracts of Joe Blanton, Placido Polanco, and Shane Victorino. Howard plays first. Utley or Martinez plays second. Rollins is at short. The Phils will have a new third-baseman and left fielder. And at best they will have Halladay, Lee, and Hamels, and at worst, Lee, Halladay, and Worley.

It was the 1980 Phillies club that won only 91 games, fewer than the 1976 and 1977 teams. But it was this team that won the club’s first World Series in its then 98-year history. The Phillies made mistakes during this past off-season by failing to replace Howard’s production at first, and Ibanez’s in left. But this franchise is not ready to head quietly into history.

After the dreadful 1979 season, the Phillies won the division, National League pennant, and World Series in 1980; won a play-off spot in the strike-shortened 1981 season; and won the pennant in 1983. The Phils may not win in 2012 but 2013 need not be a disaster.